How much g-force will you experience in a SpaceX Falcon-9 launch?
- Have you ever wondered how much g-force you would experience sitting on SpaceX Falcon-9?
- Will you experience more G’s ascending or descending?
- Will you experience more G’s powered by stage-1’s nine Merlin engines screaming or on stage-2 single vacuum engine trying to accelerate you to the orbital velocity?
If you wanted the answers, here is a hacker project that can answer it all.
Answers First
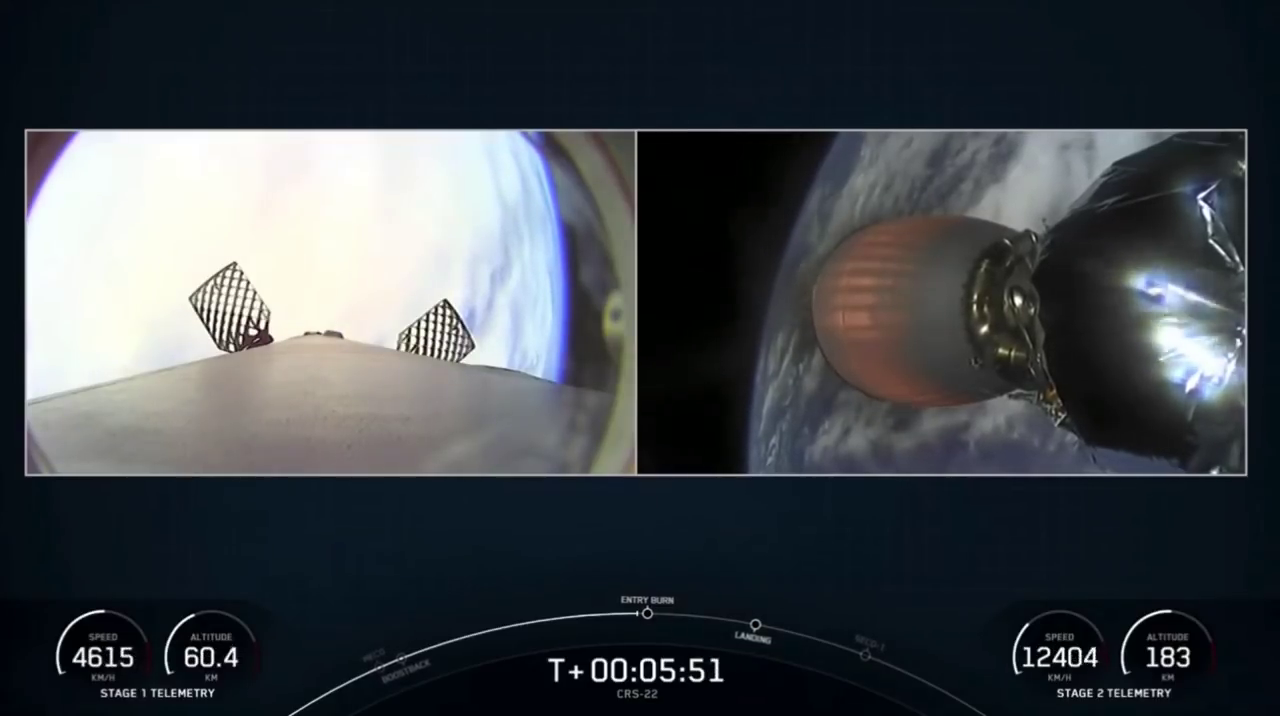
I analyzed the recent SpaceX CRS-22 launch on 3 June 2021 that delivered cargo (including the new ROLA solar array) to the International Space Station.
There were two major surprises for me.
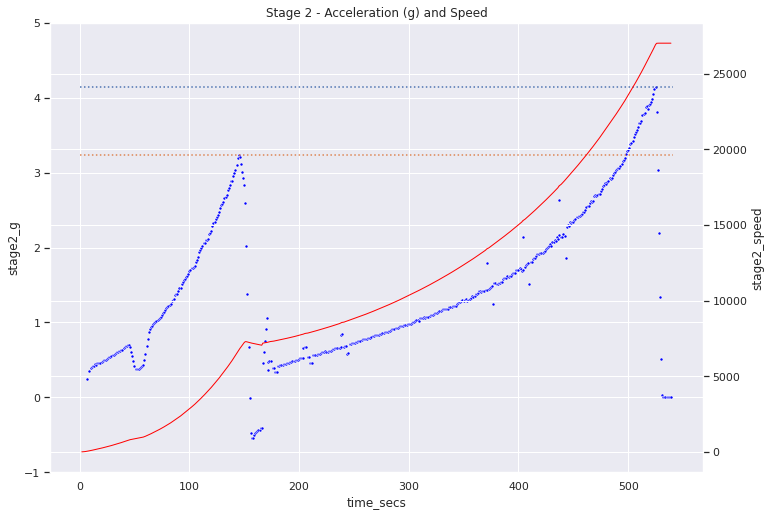
- During ascent you will experience more g-forces (4.1g) when powered by Stage-2 (closer to approaching escape velocity) than powered on from Stage-1 (3.2g - just before stage separation).
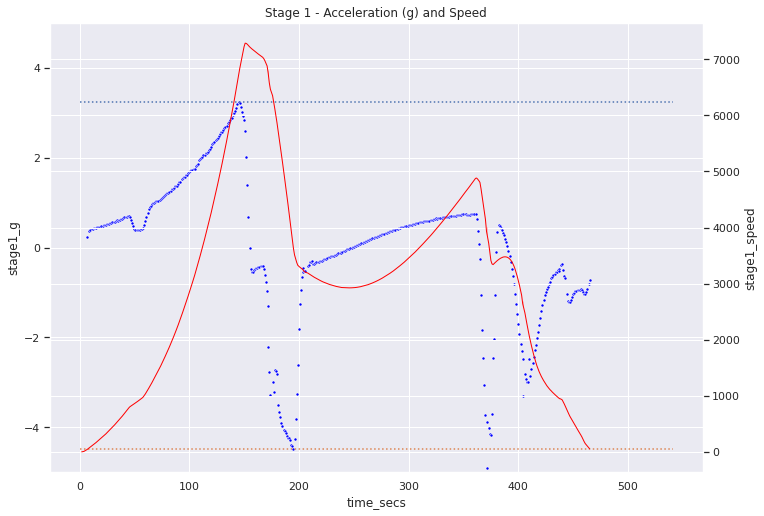
- On Stage-1 you will experience maximum g-force (-4.5g) at descent (just when engines fire back again to slow the descent). Crew is not onboard at this time and this probably is also one more reason why SpaceX Starship uses drag to slow down a lot before firing the engines.
Interesting Observations
-
Did you notice before Max-Q SpaceX mentions they are throttling down? You can see this very clearly on the stage1-g chart around 40 seconds where acceleration drops a bit.
-
When the stage1 engines shut off will you experience -1g force from earth’s gravity? The measurments show only -0.6g. The reduction in g-force is due to centrifugal force generated by 4000 kmph tangential (horizontal) velocity. For us to experience zero gravity weightlessness Stage2 needs to propel us to 27,000 kmph in the next 400 seconds.
-
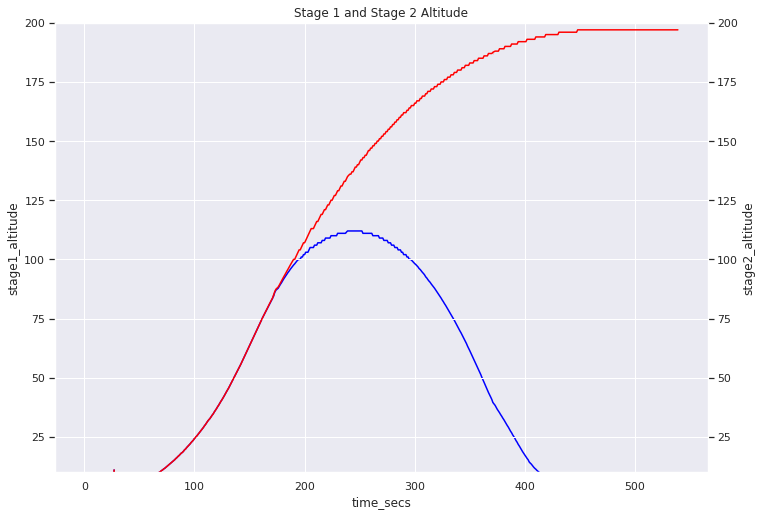
Do you notice the U in stage1 velocity between 200 and 300 seconds from launch? Also, the g chart is a bit weird going from -0.6 g to +0.6 g. What is going on? This is cleared if you look at the altitude chart below. Upto about 250 seconds or so the stage-1 is still ascending hence the gravity is opposing stage-1 (hence negative), once it hits the top of the parabolla (on the altitude chart) stage-1 starts descending and gravity starts speeding the stage1 again!. You will notice speed ramps up to almost 5000 mph before Stage-1 kicks three engines for entry burn.
How to do it yourself
This colab will walk you through all the steps if you want to repeat this yourself or want to do it for another SpaceX launch.
- Identify a SpaceX launch video that shows complete launch with telematics. I chose this video for CRS-22 launch as this already cuts out pre-launch announcements. (If you choose a complete launch announcement video it will be more than an hour long and you will need to skip to the launch frame)
- I uses Google Drive as storage to download the video and extract images. This is better than using temporary space on colab as you will loose your data if you get disconnected in the middle.
- I use pytube to download the video. YouTube supports multiple streams. This colab shows how to download 720p stream for better picture quality.
- Next step is to extract images from the video. Though the video contains 30 frames per second, I am extracting only one frame per second to save space and processing time. It seems to give enough accuracy to calculate the g-force. In colab you can pick another number to skip (default is 30). All the frames are extracted on same Google Drive folder.
- I use EasyOCR python package to read the telematics text from the images. Though the software can read entire image I got better accuracy by cropping the image before feeding it to EasyOCR. As the telematics numbers are always shown on the same place in all frames, this step helps us test out the accuracy of coordinates of the five rectangles we will crop out from the main image. The six images are stage1_speed, stage1_altitude, stage2_speed, stage2_altitude, minutes and seconds from count down clock. The complete launch takes less than 10 minutes so no need for the hour number for now.
- With the six cropping rectangle coordinates identified we are ready to loop through all images, crop them and feed to EasyOCR. As EasyOCR runs far better with GPU this is a good place to change your colab runtime and add a GPU. Remember, this will reset your python variables so you will have to reconnect with your GDrive. (Good thing we saved all the images there).
- After a few minutes we should have an array of all the telematics. We will pickle these results to GDrive so we can release the GPU and play with the numbers at leasure. Here is CRS-22 pickled results file.
- Last step is to scrub the data for outliers/bad OCR readings and perform high school physics to get acceleration!
Enjoy!
